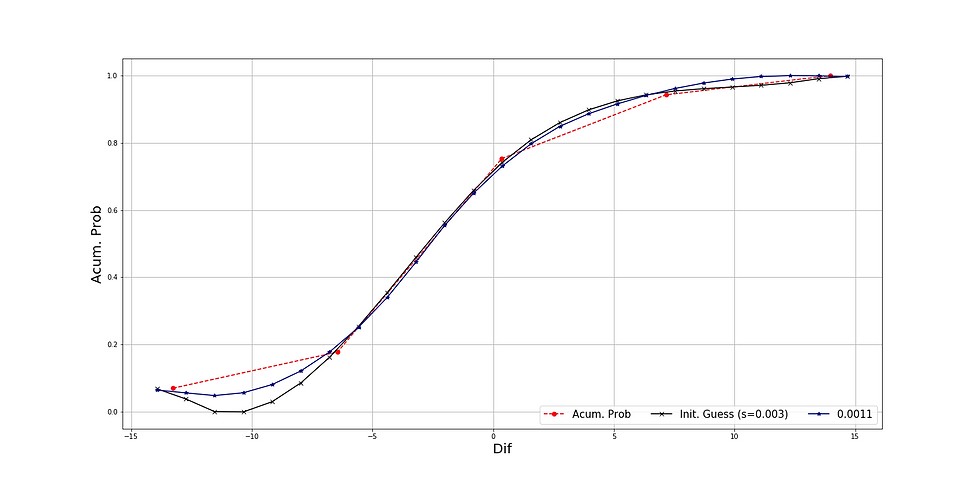
Return (▲Price), Likelihood & Probabilities: Top10 Traded ETFs in USA from 21/12/2021 to 29/03/2022.
- Alejandro Romero
- 23 Mar 2022
- 3 dakikada okunur
1. Accumulative Splines & ▲Price > 0
1. EEM
Smoothing factor: 0,0011
Recommendation: Spline to be used until 22/02/2022 then update.
Probability ▲Price > 0: 30,11%
Odds Positive Return: 0,4308
2. IWM
Smoothing factor: 0,0011
Recommendation: Spline to be used until 15/02/2022 then update.
Probability ▲Price > 0: 31,00%
Odds Positive Return: 0,4493
3. TQQQ
Smoothing factor: 0,0011
Recommendation: Spline to be used until 29/03/2022 then update.
Probability ▲Price > 0: 29,34%
Odds Positive Return: 0,4152
4. VXX
Smoothing factor: 0,0011
Recommendation: Spline to be used until 22/03/2022 then update.
Probability ▲Price > 0: 6,65%
Odds Positive Return: 0,0712
5. XLE
Smoothing factor: 0,0011
Recommendation: Spline to be used until 08/02/2022 then update.
Probability ▲Price > 0: 28,12%
Odds Positive Return: 0,3912
6. UVXY
Smoothing factor: 0,0011
Recommendation: Spline to be used until 08/03/2022 then update.
Probability ▲Price > 0: 25,15%
Odds Positive Return: 0,3360
7. QQQ
Smoothing factor: 0,0011
Recommendation: Spline to be used until 25/01/2022 then update.
Probability ▲Price > 0: 29,73%
Odds Positive Return: 0,4231
8. SPY
Smoothing factor: 0,0011
Recommendation: Spline to be used until 01/02/2022 then update.
Probability ▲Price > 0: 30,14%
Odds Positive Return: 0,4314
9. SQQQ
Smoothing factor: 0,0011
Recommendation: Spline to be used until 15/02/2022 then update.
Probability ▲Price > 0: 22,61%
Odds Positive Return: 0,2921
10. XLF
Smoothing factor: 0,0011
Recommendation: Spline to be used until 15/02/2022 then update.
Probability ▲Price > 0: 23,02%
Odds Positive Return: 0,2990
In conclusion, as in a prior post it was demonstrated that there is not significant difference between the return and risk of the Top10 traded ETFs in USA, the inner behavior of their returns give the reader information that can't be identified by the traditional time-series approach. Given the current conditions, the most logic option would be to choose IWM (iShares Russell 2000 ETF) as it offers the best odds for positive returns. On the other hand, the low odds for VXX suggest that the market will keep its positive trend the following week.
2. Probability Splines & ▲Price with Maximum Likelihood
1. EEM
Smoothing factor: 0,0032
▲Price with maximum likelihood: 0,34 USD
Distribution Likelihood: 46,72%
2. IWM
Smoothing factor: 0,0032
▲Price with maximum likelihood: 0,46 USD
Distribution Likelihood: 47,92%
3. TQQQ
Smoothing factor: 0,0032
▲Price with maximum likelihood: 0,69 USD
Distribution Likelihood: 53,67%
4. VXX
Smoothing factor: 0,0032
▲Price with maximum likelihood: -8,54 USD
Distribution Likelihood: 76,95%
5. XLE
Smoothing factor: 0,0032
▲Price with maximum likelihood: 0,47 USD
Distribution Likelihood: 50,12%
6. QQQ
Smoothing factor: 0,0032
▲Price with maximum likelihood: 1,16 USD
Distribution Likelihood: 57,65%
7. UVXY
Smoothing factor: 0,0032
▲Price with maximum likelihood: 27,83 USD
Distribution Likelihood: 61,59%
8. XLF
Smoothing factor: 0,0032
▲Price with maximum likelihood: -0,06 USD
Distribution Likelihood: 59,70%
9. SPY
Smoothing factor: 0,0032
▲Price with maximum likelihood: 4,84 USD
Distribution Likelihood: 54,87%
10. SQQQ
Consequently, what all these results say about the statistical analisys and modeling done in this and prior posts? First, in the case of distribution splines the percentage taken as "Distribution Likelihood" is a point on the curve rather than the area below it; therefore, it si important to differentiate between this and the probability concept. What is being shown here is that e.g. if the volatility drops by nearly 8,54 USD, it would be 76,95% likely that the spline is doing an accurate representation.
All these calculations are based on probabilities, which can fail sometimes; however, the developed algorithm to reach those numbers has been thought to reduce such failures to their lowest level.


Comments